What Is Prometheus Monitoring Tool?
The key aspect of data collection is continual monitoring, which is very tedious. Various tools, technology, and techniques are required to attain accuracy. Prometheus is one of the very famous open-source tools that businesses/developers dealing with metrics monitoring and aggregation use.
Delve deep into Prometheus software details with this post. Bookmark this post for future use.
What Is Prometheus Software?
Originally developed by SoundCloud in 2012, Prometheus is a globally recognized free metric monitoring and aggregation tool.
It performs these actions while converting metrics into time series data. Its major use is observed in Kubernetes. However, it’s compatible with various other cloud-native software/tools.
For each time series data, a timestamp is also provided. The label is an optional part and is formed using the key and value of the metrics. Labels can be easily collected and recorded for future use. Because of its certain distinct features, it gained huge popularity and is now part of CNCF.
It’s a Go-based tool and is licensed as per the Apache 2 License policies. As it’s an open-source tool, the source code is accessible via GitHub. It’s a cross-platform tool
History of Prometheus
From its early inception in 2012, Prometheus has come a long way and is immensely popular. Let’s have a look at its history. It was developed on SoundCloud in 2012 and was officially launched in 2013 as a leading production monitoring resource.
As it continued to grow, CNCF adopted it in 2016 and made it a certified incubated project. Before Prometheus, Kubernetes earned this status. In July 2016, the first update, Prometheus 1.0, was launched. The second update came into being in November 2017.
How Does Prometheus Work?
As mentioned earlier, Prometheus deals in the metrics mainly. Now, it requires the exposed HTTP endpoints to access the desired metrics. Generally, it starts with numerical data scraping. Once scraping is done, data is accessed as time series and stored in a local database. At times, when there is too much data to store, Prometheus often takes the help of some remote storage repositories.
The tool enables administrators and developers to manage the production computer resources such as databases, tools, applications, and networks that are required to maintain the workflow of famous websites.
With the help of source queries, the users can easily contrive short-lived time series that are further defined using metric labels and names. PromQL is used to generate the queries. As PromQL is a time-series compatible language, the software is capable of collecting and aggregating real-time time series data.
PromQL also assists greatly in generating the alert conditions that are further used to share messages to a wide range of systems like Slack or email.
All the processed and analyzed time-series data is later displayed in a web-based interface. The software aims to make data easy to understand. Hence, the analyzed data is often represented in the form of a graph and tabular format.
Often APIS is used to impart integration capabilities with leading virtualization tools. This way, data display becomes very interactive.
Test your WAF with the free open-source tool - GoTestWAF
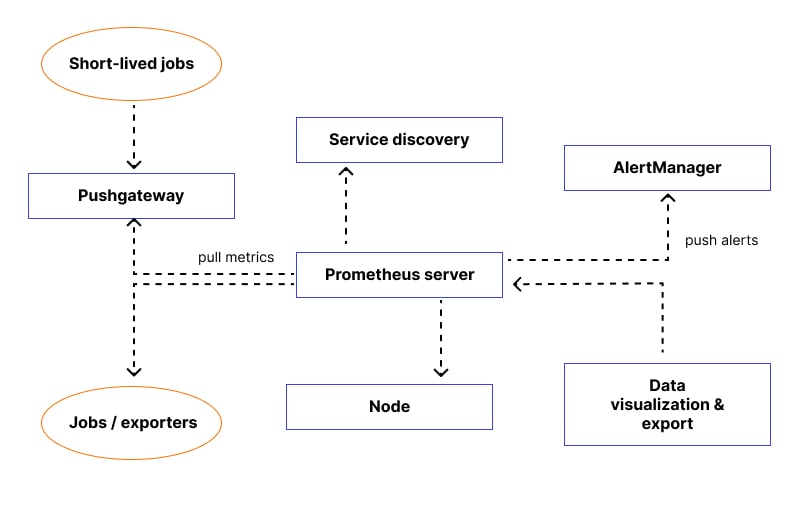
Prometheus Components and Architecture
Prometheus is a collection of multiple tools and components, each one playing a distinct task. As one tends to make the most out of this tool, understanding its architecture and key elements pays off well, as end-users will know which is responsible for what job.
Let’s look closely at consider-worthy elements related to Prometheus:
- Prometheus Server
One of the key components, the Prometheus server, is used for metrics scraping and storage. It also takes care of monitoring job scheduling that is required for entailing the querying of data sources. The server used one or more than one scrape config directive to set up the monitoring jobs.
Here, scrape configs are processed using a YAML configuration file. SD or Service Discovery is what the server uses to spot the scrape targets. Based on the requirements, SD techniques often feature integrations like generic API and file-based SDs.
The server often collects client libraries handling the HTTP endpoints that are later used by multiple instrument applications.
- Exporters
This element supplies data to the server. Basically, a Prometheus exporter is a key monitoring system that is not based on embedded instrumentations for data accumulation.
The exporter is made-up of servers and libraries that are designed for exporting the targeted metrics from multiple 3rd party systems. It’s an ideal substitute for an impractical instrumenting system in Prometheus architecture.
In its simplest explanation, exporters are often defined as monitoring agents sharing the same purpose. All these agents aim to accumulate the 3rd party system-metrics and make them accessible using the server.
- Prometheus Pushgateway
It is used to access metrics that are required to be pushed from multiple other systems. Often, Pushgateway fetches metrics that are not compatible with pull-based infrastructure.
Consider ephemeral batch tasks as an ideal use case of Pushgateway. This infrastructure opens and shuts before Prometheus starts the metrics scraping. Use Pushgateway here as it enables the tool to push such metrics and prevent the misplacing of crucial data.
- Service Discovery
SD enables the tool to find out where exporters are running. With this, the tool manages to find out which metrics to watch out for, unresponsive metrics, and other crucial details. It holds great significance in a dynamic environment.
- Client Libraries
The client library is used to collect the generated metrics that are generated after the instrumentation of an application code. The tool supports Ruby, Go, Python, and Java-based client libraries. However, client libraries are also available for Dart, .Net, Haskell, C#, Rust, Lisp, and many more languages.
When Prometheus software is deployed, it’s important to make sure that the used client library should be compatible with the language of the application. If these two don’t match, it won’t be easy to define and expose the internal metrics.
- Scraping
Scraping is a basic capability of Prometheus and comes after SD and relabeling. After successful service delivery and scraping, the tool will have a list of targets that needs to be monitored. The next action that the tool has to take is to fetch the metrics, which is done with the help of forwarding an HTTP request. The HTTP request is scraped. Its response is further parsed and stored in a storage.
The scraping continues to happen all the time and often takes place at a time interval of 10 to 60 seconds.
- Storage
Prometheus Kubernetes needs a storage system to store all the collected time series data.
Mainly, this store is a locally-deployed custom database and makes the tool reliable for distributed systems like Prometheus Docker.
The Prometheus storage has gone through multiple changes since its inception and is now capable of handling more than a million metrics or samples in a second. Because of this high-end capability, the server can watch out over thousands of machines at a time. One might need an SSD for storage, but it’s not mandatory.
- Dashboards
The tool enables one to create an interactive dashboard using Grafana. Why so? Grafana is packed with a wide range of features and supports full dashboard customization. It can integrate various servers in a single dashboard.
- Alert Management
As HTTP APIs are used in abundance, there is no leniency allowed to manage the alerts and APIs. Prometheus features Alertmanager as a seamless alert management tool that receives automatic alerts from the server and converts them into real-time notifications. Mostly, these notifications are in the form of chats and emails.
As it controls the human responses and ensures no unwanted intervention is entertained, it holds great importance from an API security point of view.

What Can I Control With Prometheus?
With smart usage, Prometheus cloud native tool can help you monitor or control a wide range of metrics and functions. Let’s discuss the key ones.
- Service Metrics
The very customary use of Prometheus software is to collect continuously running service metrics. Not only it collects the service metrics but also it makes them accessible with the help of HTTP-based endpoints both via using client libraries and manually.
The tool is preferred for service metrics collection because it displays data in an austere manner. Every service metric will remain in line and will be separated from other metrics using a line feed character.
As the service metric will be hosted/published on an HTTP-server, Prometheus software can scrape or query the stored metrics. Businesses often use the tool to execute various service metrics, hosted on different hosts.
- Host Metrics
The OS of Prometheus is capable of providing information on hosting-related metrics. It can guide you to find out whether or not the hard disk is completely full. For more detailed insights on host metrics, it’s suggested to take the help of an exporter that will collect OS details and publish them on an HTTP address.
- Uptime/Status of the Website
You can’t use Prometheus for through-and-through website monitoring as it lacks competency. But you can certainly use it to track metrics like uptime or the website's status. Pair it with the BlackBox exporter, and it will help you track the uptime by simply defining the target URL.
- Cronjobs
Lastly, Prometheus can help you track the cron jobs. For this to happen, you have to use Push Gateway, and the tool will let you know whether or not the cronjob is functional. HTTP endpoint is required to track this metric.
As cron jobs will be timestamped, it’s easy to find out the availability by comparing the present and last successful cronjobs.
What Prometheus Can’t Do?
While Prometheus is capable of doing tons of things, as we just explained, it falls short on various fronts. For instance:
- It fails to provide 100% assurance of the accuracy of collected data. Even if it promises reliability, it disappoints big time when one tends to accumulate sensitive statistics that need constant improvements. For such metrics, it’s better to lay your trust in something else.
- It has no support to offer if you’re seeking a highly advanced customized dashboard. The core of this software is effective event querying via HTTP APIs and in-build web UI. But,
- support of certain integrations is always required. You can’t deploy it as a standalone tool.
Conclusion
At the very core, Prometheus is a great technology to adopt when the goal is to do an effective store of time series data with proper timestamps. Try it to monitor the crucial metrics of an application and sort metric queries with the least possible hassles. Its interactive UI makes it beginner-friendly software.
However, this is not always a great deal of good. Don’t expect 100% accuracy in time-series data as it’s not delivered. Also, using it as a standalone tool will be your biggest mistake. Weigh down your requirements and its offering and try to find a middle path. With due diligence, Prometheus will certainly deliver quality performance.
FAQ
Subscribe for the latest news


.jpeg)