What is Jaeger?
While distributed and microservices-based systems bring a lot to the table and have expanded capabilities to offer, it takes a lot to keep dispersed elements together. Jaeger, a notable open-source tool, provides tracing abilities that sorts multiple things. Anyone dealing with distributed/microservices development must be aware of this open-source tool.
Want to know more? Read this post. We have covered Jaeger tracing, its meaning, significance, and other related concepts. Let’s begin with Jaeger’s underlying concept.
What is distributed tracing?
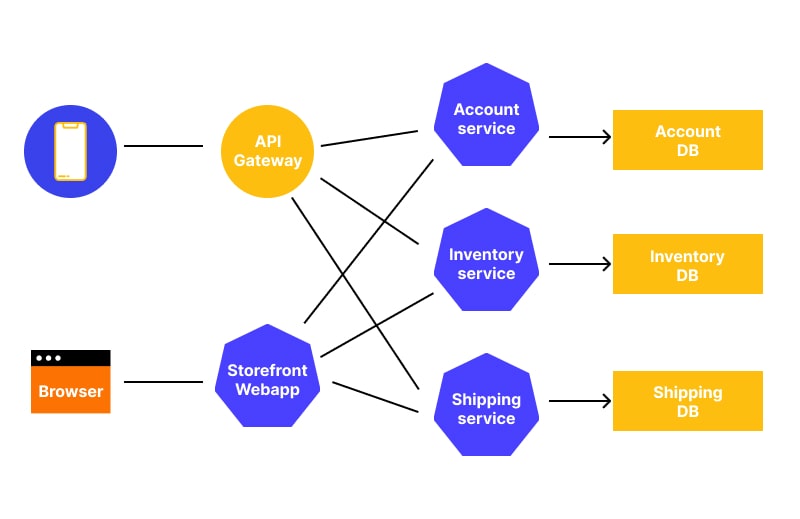
As Jaeger is all about tracing, it’s better to understand what it means in a distributed system. Bringing different contributing elements together and ensuring constant communication between all those microservices components is the biggest challenge.
Monolith architecture is excessively simplified in this sense as there is only one aspect to deal with. In microservices-based and distributed systems, developers have to keep a tab on the flow of a component between two or more services.
Distributed tracing comes into the picture as it ensures that data, distributed across multiple services, is available at a centralized platform. There is another way to understand it; it's having observability of every event taking place within microservices.
By keeping tabs on critical data and its flow, distributed tracing aids greatly in optimization and debugging.
Mostly, it’s part of service mesh and plays a crucial part in microservices management. It’s a key functionality of Jaeger as the tool uses it to track the request path. In addition, the concept helps in reduced latency, RCA, and distributed transaction monitoring.
What is Jaeger: Meaning and Responsibilities
In general, it is a distributed tracing solution used widely for monitoring and troubleshooting microservices. It provides an understandable visualization to make sense of the events taking place at different microservices. The other name for this concept is Jaeger Tracing as it runs behind the request path and traces.
It’s one of the key development components for microservices. As we all know that microservices feature multiple standalone applications owning distinct RESTful API, logic, and database. They take the help of requests and responses to communicate with each other.
Jaeger keeps everything sorted by traces and logs. The key responsibilities that it handles are:
- Keeping data movement within and outside the microservices ecosystem
- Spotting the issues causing performance slowdown
- Figuring out the root of an issue
- Tracking out all the components upon which microservices depend
- Promoting distributed content propagation so that the concerned application can transfer the descriptive information with relevant data.
Jaeger components
- Instrumentation
This component is meant for the telemetry data generation process. The concerned data here is related to traces, logs data, and metrics. Application code is used to develop the telemetry data. With the help of instrumentation, it’s possible to have the aid of telemetry data that later assists in error investigation.
In most cases, tools like SDKs, agents, and client libraries are used for instrumentation. In the case of Jaeger, OpenTracing API-based client libraries are used for instrumentation.

Earlier, OpenTracing worked alone and merged with OpenTelemetry later. Jaeger provides multiple client libraries based on languages like Java, Go, C++, Node.js, and C#. Keep in mind that the service starts generating incoming transaction spans soon after instrumentation.
- Web UI/Visualization
The basic UI of Jaeger becomes highly comprehensive when it becomes part of distributed tracing.
- Data Pipeline
The next Jaeger component is Data Pipeline assisting greatly in accepting data in multiple formats. When a service manages to collect trace data, it forwards it directly to the bank end storage for further visualization. If data is left unmonitored during that phase, certain mishaps tend to happen.
The data pipeline is what Jaeger is using at this point. It traces data buffering and supports activities like batching, queueing, indexing, and manipulation.
- Backend Storage
Jaeger takes the help of straightforward in-memory storage for the backend so that data can be used for testing. Cassandra and ElasticSearch are the two most famous trace storages that Jaeger uses.
Sampling
Sampling is an integral part of Jaeger and its libraries' samples 0.1% of traces. Jaeger clients can easily seize the sampling strategies and modify the sampling rate using multiple strategies like Const sampler, probabilistic sampler, opentracing.jaeger.const-sampler.decision = true | false, rate-limiting sampler, and so on.
While one tries to understand what Jaeger sampling means, it’s important to learn that it’s a complex concept and takes place in two places.
Let’s understand it in detail.
Sampling at the Distro (SDK) level
Sampling taking place at the client code or SDK level is also known as head-based sampling. It has four sampling modes.
Remote (1st mode - default): It helps Jaeger clients to know that sampling has moved from Jaeger's backend and that further actions can be taken.
Constant: It instructs the client to accept all the traces or leave all. No other scenario is concerned. When all the traces are picked, 1 is displayed as the result and when no trace is picked, 0 is displayed as a result.
Rate Limiting: It helps a client to decide the number of traces that can be sampled in a second.
Probabilistic: It lets the client decide the most optimal trace percentage.
Collector Level Sampling
It supports two modes and is also known as tail-based sampling.
The first mode is file sampling. It refers to explaining to the collector the configuration file path. The concerning file generally features per-operation as well as per-service sampling configuration data.
The next supportive mode is an adaptive sampling that is based on the adaptive sampler. Now, what is it? It’s a composite sampler bringing two key sampling functions together.
A sampling at this level occurs at the Jaeger Collector.
For Instance, it aids greatly in taking sampling decisions based on the per-operation concept. This method is generally used in cases where APIs, featuring multiple endpoints, are used.
It also aids greatly in deciding the sampling rate threshold. In this case, every action is based on per-services parameters that one can easily configure statistically. You can also fetch this parameter from the Jaeger backend using Remote Sampler.
Using static sampling strategies, Collector instantiates the trace. The --sampling and strategies-file option is used here.
Jaeger Client Obsolescence In Favor of OpenTelemetry Distribution
The recent announcement about OpenTelemetry has stirred the Jaeger community as it confirmed the OpenCensus and OpenTracing merger. Even after the merger, Jaeger deploys OpenTracing. What does it mean?
First, you need to understand that Jaeger tracing is closely linked with OpenTracing specification. Due to certain complications, Jaeger’s popularity is constantly decreasing. The existing Jaeger clients are not favoring OpenTelemetry SDK as one is allowed to use compatible language. Also, Jaeger exporter can be bed used.
The use of Jaeger exporter spans creation in Jaeger distributed tracing and converts it into a friendly format. Such friendly spans can easily travel back and forth between storage & Jaeger collector.
Presently, it’s too early to conclude that OpenTelemetry is a complete Jaeger tracing collector replacement. But, it may become one in the future as Jaeger is experiencing a great dip in its popularity.
Effortlessly, OpenTelemetry fills the caveats of Jaeger and provides users with a feature-rich single standard. The developer community is loving this for its peerless features like backward compatibility with OpenTracing and OpenCensus and not adding unwanted features. It works like a unified observability platform and keeps things simpler than ever, which is not the case with Jaeger cloud native tool.
Limitations of using Jaeger as a distributed tracing tool
Jaeger has a far-flung use case but it has certain limitations as through-and-through troubleshooting demands access to multiple metrics, along with traces. For instance, response time metric, CPU usage metric, error rate metric, and so on. These metrics provide better insights into the overall condition of an application.
As Jaeger fails to track these metrics, it lacks on multiple fronts. For instance:
It will only do data tracing and force users to take the help of metrics and log management tracing tools. Using more than one tool for the same job makes things too clumsy.
- The databases that Jaeger uses demands high-level maintenance.
- It’s not a very visually pleasing tool as its web UI is very basic.
- It fails to provide seamless and quick insights into the key data.
Jaeger Tracing Alternatives
To overcome the Jaeger-causing issue, users can consider a few viable Jaeger alternatives such as:
- Aspecto is a highly OpenTelemetry-compatible distributed tracing platform that can handle troubleshooting and performance tracking in one go. It helps you trace the lifecycle of an error by keeping logs and traces.
- Lightstep is preferred by those seeking a centralized tool for observability and incident response. It aids greatly the IT team in incident resolution by combining data tracing and metrics. This way, it grants great system observability. Features like change intelligence and Notebook simplify things on multiple fronts.
- Logz.io is very much similar to Lightstep and provides a few extra capabilities for those who have loyalty towards Jaeger and are looking for a bit more managed assistance. It provides a real-time alerting and service monitoring dashboard.
Conclusion
Jaeger is wise to make for microservices and distributed system development as it helps in data and event tracing. However, it’s not a flawless solution as it can’t track metrics leaving troubleshooting and management midway.
One can always have more choices to make. Pay attention to your development goals and prepare an efficient data, logs, and metric tracing system for more robust communication.
FAQ
Subscribe for the latest news


.jpeg)